
by Sachse Team | Aug 30, 2019 | Construction, Industry News, Press Releases, Sachse Press
Are you in the contracting business and trying to understand the different bonds that you may need on a project? Many people do not realize that construction surety bonds have been around since ancient times, but that does not mean that everyone is familiar with how...

by Sachse Team | Aug 28, 2019 | Construction, Featured Press, Industry News, Office, Sachse Press, Sectors
Varnum LLP has opened a new office in Birmingham as part of a plan to expand its Southeast Michigan presence as large as its base in West Michigan. The firm, headquartered in Grand Rapids, last week opened an 8,000-square-foot office off Brown Street in the...

by Sachse Team | Aug 16, 2019 | Business, Construction, Featured Press, Headlines, Industry News, Multi-Family & Hospitality, Sachse Press, Sectors
Lendlease, AECOM, Suffolk, Clark Group, and Gilbane top the rankings of the nation’s largest multifamily sector contractors and construction management firms, as reported in Building Design+Construction’s 2019 Giants 300 Report. Click here to view the full...

by Sachse Team | Aug 14, 2019 | Construction, Featured Post, Featured Press, Headlines, Industry News, National, Press Releases, Retail & Restaurant, Sachse Press, Sectors
Transitioning an online marketplace to a brick and mortar retail space can be overwhelming, but finding the right construction partner doesn’t need to be. When considering your options, use these three questions as a guide to evaluating the best construction partner...
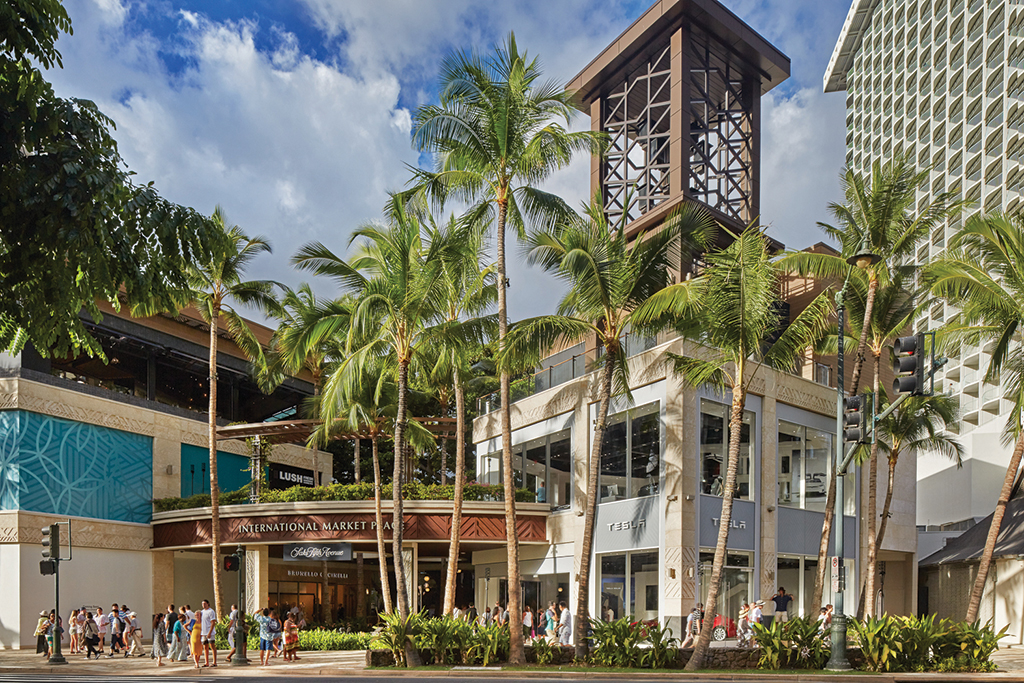
by Sachse Team | Aug 14, 2019 | Featured Press, Headlines, National, Press Releases, Retail & Restaurant, Sachse Press, Sectors
Finding the right tenant coordination partner is crucial to the success of a retail center or mixed-use urban development project. Multi-tenant property owners and developers appreciate the convenience and efficiency of full-service tenant coordination teams. From...


Recent Comments