by Zak DeHondt | Jun 29, 2020 | Business, Construction, Headlines, Industry News, Sachse Press
1. BARTON MALOW CO. 26500 American Dr. Southfield 48034 248-436-5000 bartonmalow.com 2019 Revenue: NA 2018 Revenue: $1.9B Regional Employees: 2,200 Top Local Executive: Ryan Maibach, president 2. BELFOR HOLDINGS INC. 185 Oakland Ave., Ste. 15 Birmingham 48009...
by Zak DeHondt | Jun 29, 2020 | Construction, Featured Post, Industry News, Sachse Press
RANK 2020 FIRM TOTAL REVENUE 1 AECOM, Los Angeles, Calif. 4118.1 2 JLL, Chicago, Ill. 3085.2 3 JACOBS, Dallas, Texas 2826.1 4 PARSONS, Centreville, Va. 1853.8 5 CBRE, Los Angeles, Calif. 1489.2 6 BECHTEL, Reston, Va. 971.0 7 SNC-LAVALIN INC., Tampa, Fla. 311.2 8 HDR,...
by Zak DeHondt | Jun 29, 2020 | Construction, Featured Press, Industry News, Sachse Press
RANK 2020 RANK 2019 FIRM FIRM TYPE TOTAL 2019 REV. ($ MIL.) 1 2 AECOM, Los Angeles, Calif. EA 4118.1 2 1 BECHTEL, Reston, Va. EC 3227.0 3 4 JLL, Chicago, Ill. CM 3085.2 4 3 JACOBS, Dallas, Texas EA 3061.0 5 5 PARSONS, Centreville, Va. EC 2396.5 6 6 CBRE, Los Angeles,...
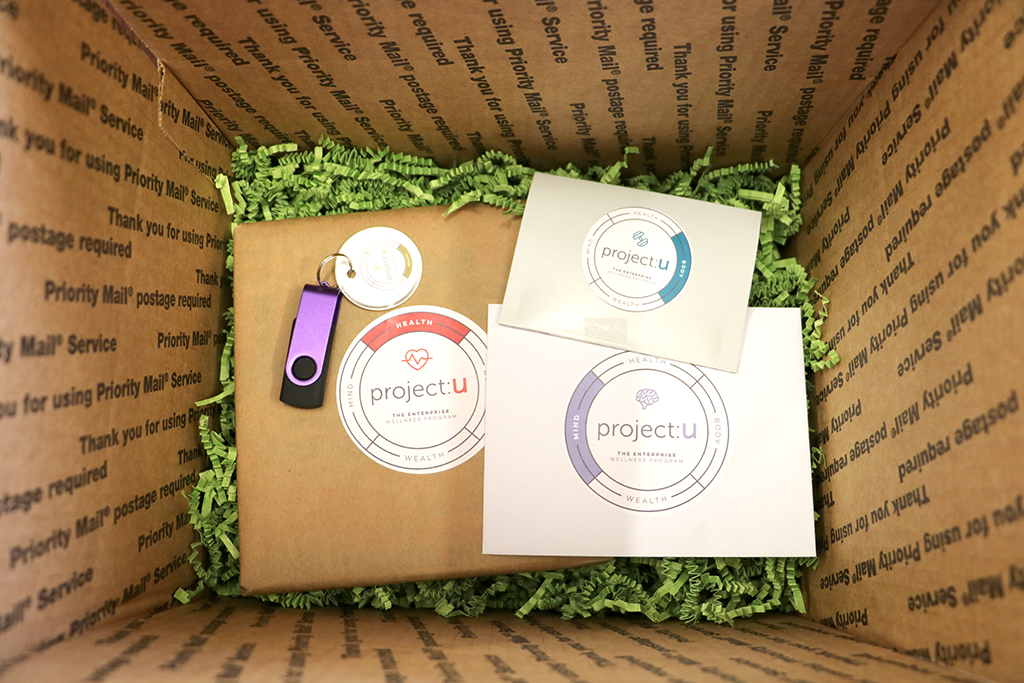
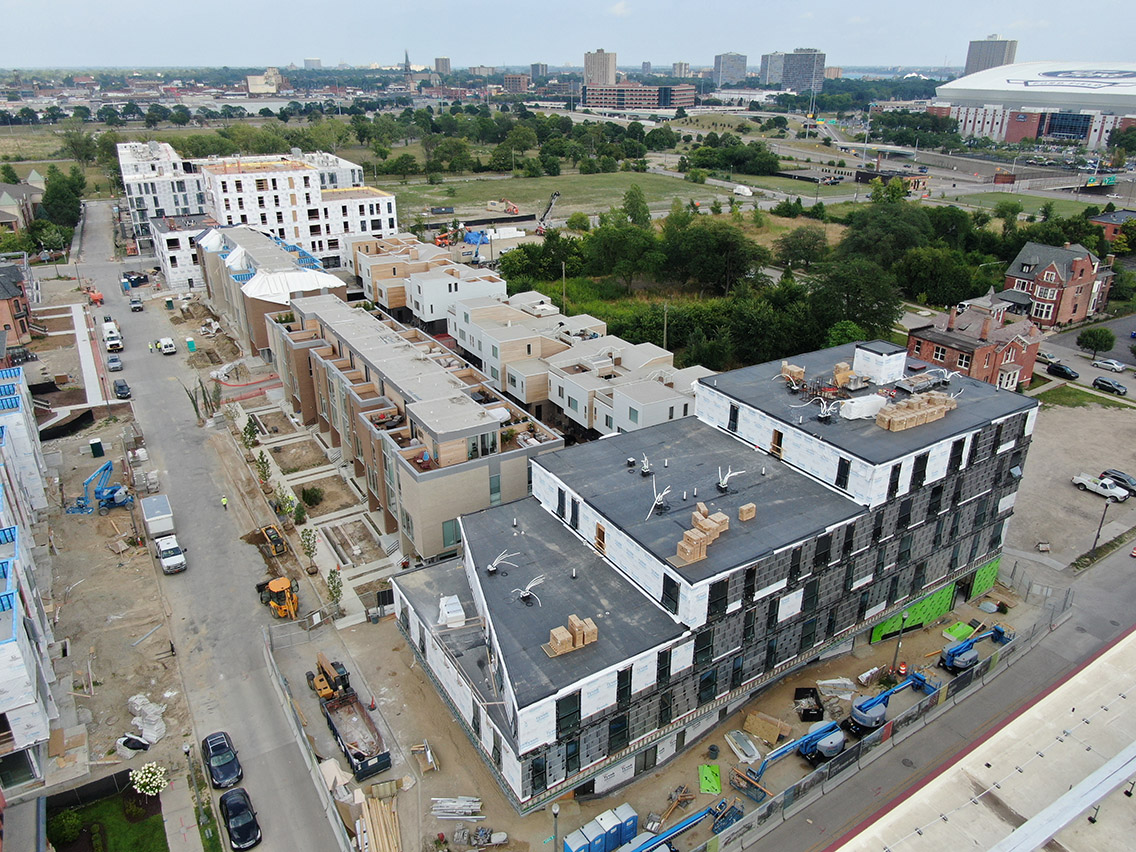
by Zak DeHondt | Jun 15, 2020 | Construction, Featured Press, Industry News, Sachse Press
Sachse Construction has seen an increase in retention and a rise in employee engagement scores since its People & Perks department launched a company-wide wellness program. The Detroit-based construction management and general contracting firm has 170 employees...
by Zak DeHondt | Jun 3, 2020 | Business, Construction, Featured Press, Headlines, Industry News, Sachse Press
What are you obsessed with? At Sachse Construction, we have five obsessions: customers, feedback, innovation, team members, and training. While these obsessions are not the only driving force behind our day-to-day operations (hello, Core Values, Rayisms, and...


Recent Comments