
by Sachse Team | Oct 26, 2018 | Architecture & Design, Construction, Featured Post, Featured Press, Industry News, Recreation, Sachse Press, Sectors
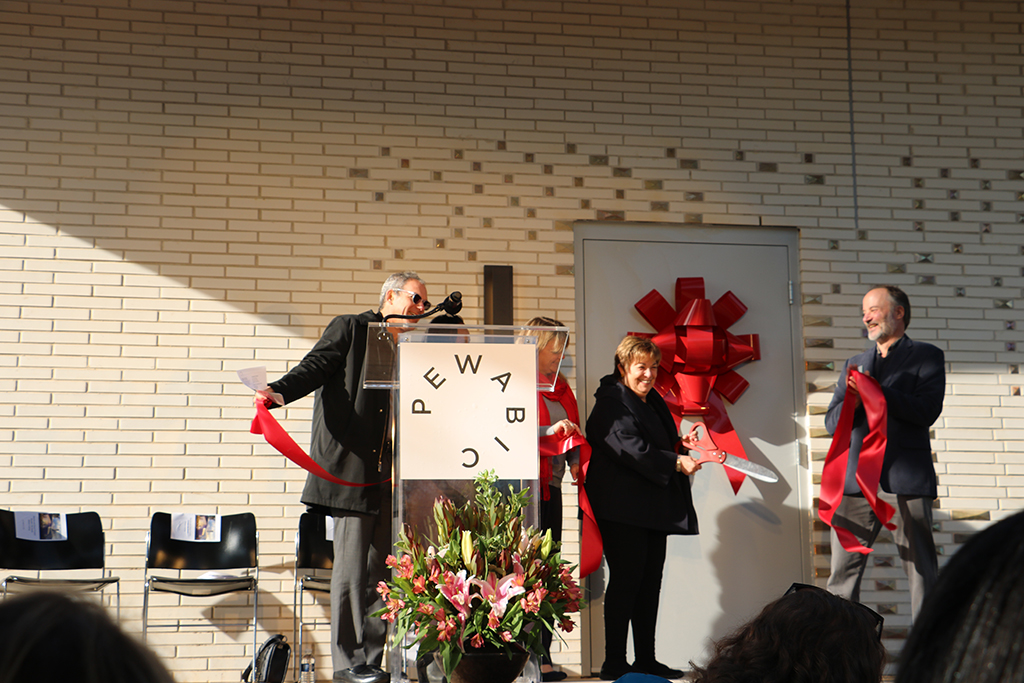
In another sign of new life percolating through the city, Detroit’s Pewabic Pottery cut the ribbon Thursday on its first addition since 1912. The $1.1 million Maxine and Stuart Frankel Pewabic Tile Studio adds 2,500 square feet to the celebrated pottery center...

by Sachse Team | Oct 25, 2018 | Construction, Economy & Employment, Featured Press, Headlines, Industry News, Sachse Press
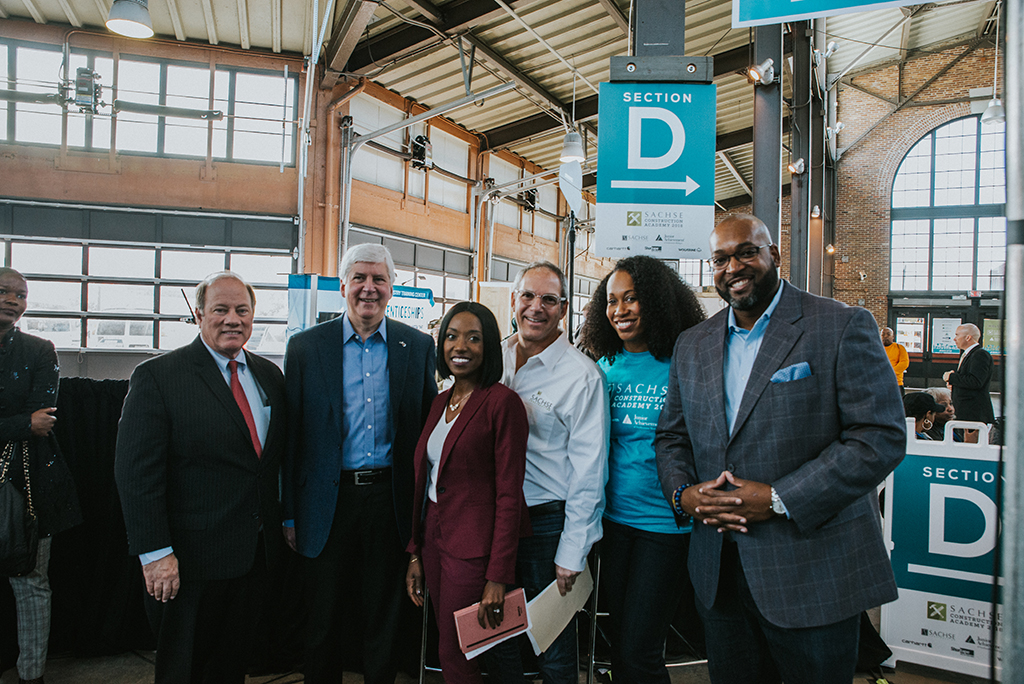
Hundreds of Detroit-area high school students got a chance to try their hands at skilled trades Tuesday for the third annual Sachse Construction Academy in Eastern Market. There were dozens of modules and speakers, including Detroit Mayor Mike Duggan and Michigan Gov....
by Sachse Team | Oct 25, 2018 | Architecture & Design, Construction, Featured Post, Featured Press, Industry News, Recreation, Retail & Restaurant, Sachse Press, Sectors
Pottery nonprofit Pewabic has finished a $1.1 million expansion to its historic Detroit building that it expects to nearly double production capacity. The 115-year-old ceramics studio housed in a national historic landmark is most well-known for its decorative tiles....
by Sachse Team | Oct 25, 2018 | Architecture & Design, Construction, Featured Press, Industry News, Recreation, Retail & Restaurant, Sachse Press, Sectors
Historic Pewabic Pottery on East Jefferson held a ceremony today to officially unveil its first physical expansion since 1912. The Maxine and Stuart Frankel Pewabic Tile Studio adds necessary production space for the ceramics-maker, and adds a fresh, contemporary look...
by Sachse Team | Oct 24, 2018 | Construction, Economy & Employment, Featured Press, Headlines, Industry News, Sachse Press
Michigan Gov. Rick Snyder and Detroit Mayor Mike Duggan will be among the dignitaries on hand to help introduce area high school students to the skilled trades. They plan to speak Tuesday at the third Sachse Construction Academy at Detroit’s Eastern Market. The event...


Recent Comments