January 2020 - Sachse Construction

Navigant research report finds global wind capacity value is expected to increase tenfold over the next decade

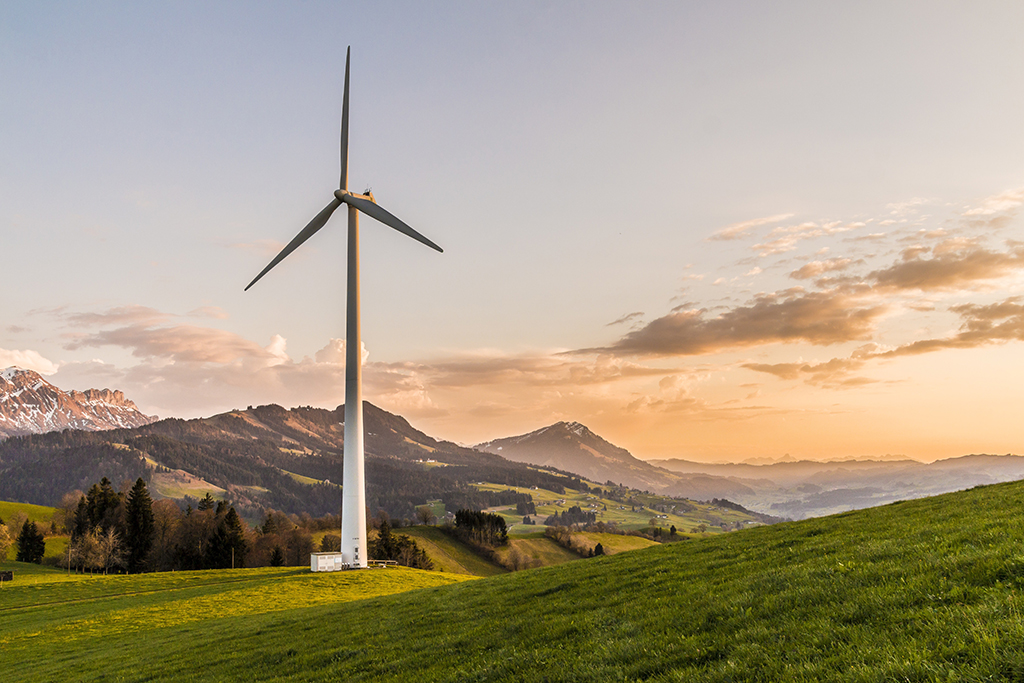
A new report from Navigant Research analyzes the global wind power market to assess current and future development cycles and projections for new installed wind capacity. The report provides global market forecasts, segmented by region, through 2028.

Global wind industry installations were flat from 2017 to 2018, but behind the flat figures are profound shifts throughout global wind power markets. Some mature markets are facing flat or declining growth due to adjustments to more competitive policy environments and reductions or eliminations of subsidies. However, these changes are being offset by increasing wind power development in countries that were not previously wind power markets. This new capacity represents a market worth more than $92 billion in 2019 and more than $1 trillion over the forecast decade.

“Growth in wind capacity is led by countries in Asia Pacific and non-traditional markets in Europe, Latin America, and the Middle East & Africa,” says Jesse Broehl, senior research analyst with Navigant Research. “Wind power is being developed not only in a greater variety of countries but also increasingly in offshore as well as onshore.”

According to the report, global offshore wind development is expected to experience a 16% compound annual growth rate over a 10-year forecast period. China, Taiwan, and Europe are the leading markets, with the US soon to join when the first large-scale offshore wind plants are commissioned in coming years along the northeast coast of the country. The report also examines the annual installed capacity of top global wind turbine original equipment manufacturers (OEMs) and related market share and ranking. The most recent year-end 2018 data shows Denmark-based Vestas retaking the global total annual capacity lead and three other Western OEMs falling in the global total annual rankings. The turbine OEM market dynamics show consolidation throughout the sector, with top OEMs commanding larger market shares.

The report, Global Wind Energy Overview, analyzes the global wind power market to assess current and future development cycles and projections for new installed wind capacity. The study provides an analysis of the market issues related to wind development, including drivers and barriers such as power contract auction rates, volume, and related policy and market environments. Global market forecasts, segmented by region, extend through 2028. The report also summarizes the key industry players related to wind power development. An Executive Summary of the report is available for free download on the Navigant Research website.

How Material Simulation During Design Ensures Accurate Construction Performance

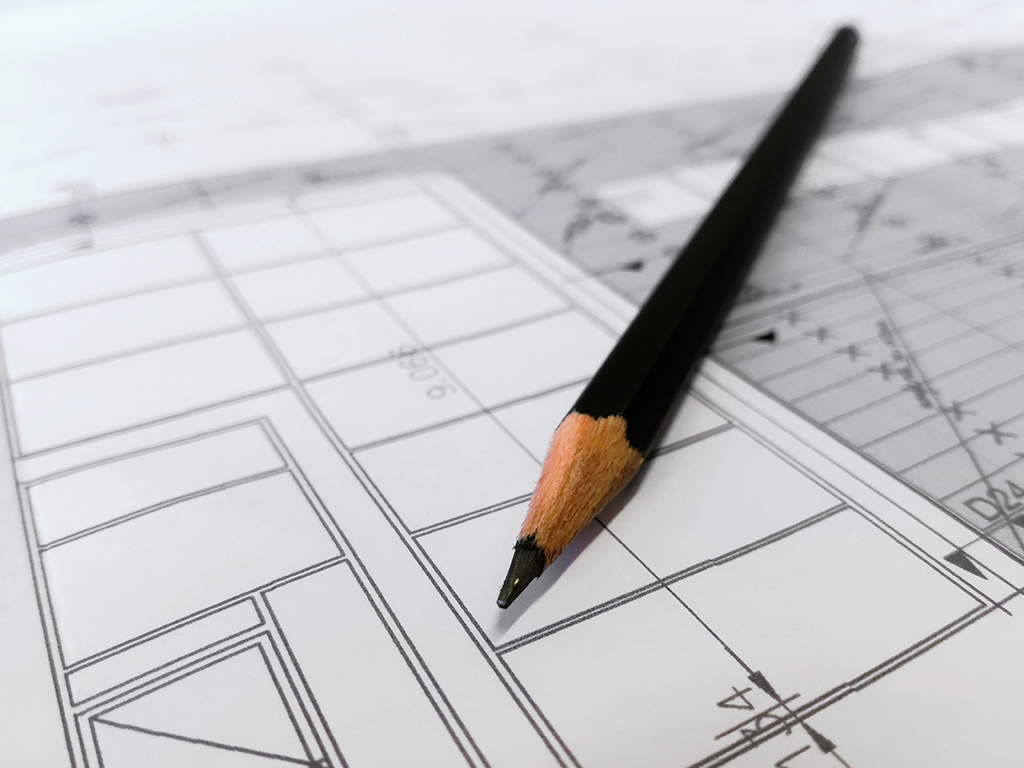
With the amount of information and technology we currently have, whether from academic research or from the manufacturers of construction products themselves, there is very little room for empiricism and experimentation when we design on the most diverse scales. Even worse is when design specification misconceptions can pose huge costs and headaches. However, long before construction and occupancy of the building, it is possible to clearly understand how the construction will function thermally, its photovoltaic power generation capacity, and even how much power will be required to cool and/or heat it. There are software, tools and applications that allow you to quantify all these design decisions to avoid errors, extra costs, unnecessary waste generation, and ensure the efficiency of all materials applied.

With the increasingly widespread adoption of BIM (Building Information Modeling), the virtual models of new projects or even of renovations and retrofits are becoming more and more accurate, allowing greater cost control and efficiency in the work. There is the possibility to simulate the completed building, understanding its behavior before the start of construction, and supporting the project throughout its phases, including after it is built, or even disassembled and demolished. With better control of the design stage, it is possible to size and order the most accurate quantities and dimensions of the products that make up the construction.

When we approach thermal efficiency of a building, there is no getting around the “Facade” issue. The building envelope is the first barrier between the exterior and interior climate, where heat exchanges occur. Thermal transmittance, also called U-value, allows us to know the level of thermal insulation in relation to the percentage of energy that goes through the envelope; if the resulting number is low, we have a well-insulated surface. On the contrary, a high number will alert us to a thermally deficient surface. This analysis is made for all materials such as tiles, masonry, plaster, etc. For glass there are some special parameters.

Though often considered the villain, there are already several glass options on the market for various uses, which vary in thermal characteristics, colors, and their relationship between interior and exterior. Saint-Gobain has a huge range of project solutions that work for a variety of situations. When specifying glass for a project, it is essential to take some factors into account:

  • Its use and location. Is it a residential or a commercial project? Is it facing south or east? In São Paulo or Stockholm?
  • The type of planned facade. Curtain wall? Double skin? Indented frames?
  • What is the desired aesthetic, not only of the glass, but of the amount and the frames. Grayed out? Bluish? Reflective, not reflective?

On top of safety, acoustic or aesthetic considerations, and the location and orientation of the building, when specifying a glass, it is also important to take into account some of its properties:

  • Light transmission: Percentage of visible light transmitted directly through the glass.
  • Radiation reflection: Percentage of visible light reflected directly from the outer surface of the glass.
  • U-value: The U-value is a measure of the heat loss from penetrating the glass. The lower the U value, the better the insulating properties. Expressed in W / m2K.
  • Color rendering index: Capacity of the glass to keep colors equal, as if they were observed without glazing. Measured on a scale of 1 to 100. A low CRI provides blurry colors and a high CRI provides natural, bright colors.
  • Solar factor: Percentage of solar energy transmitted through glass. Therefore, it measures the ability of a window to reduce the heating of the room. The lower the solar factor, the better it helps improve comfort within the building.
  • Selectivity: The selectivity of the glass is expressed as the ratio between its transmission of light and the solar factor. When the selectivity of the glass is greater than 2, it provides twice as much light as heat.

With these parameters in mind, glass performance tables are extremely important information in the product specification stage for projects, as they allow you to easily compare the performance of the products to understand the most appropriate use for each case, compiling all the data collected previously.

There are also digital simulation programs that can contribute to a more correct and appropriate decision for each situation. Calumen Live, for example, calculates the lighting, energy and thermal performance of any individual glass or combination of glass types and thicknesses for double and triple insulating glass units. It generates calculation reports to compare the performance of alternative configurations and arrive at a well founded solution, with good long-term efficiency.

Another concern when using special and technological glasses concerns the aesthetics and colors they bring to the project. GlassPro is an interactive software that simulates a realistic image of different glass products on building facades and allows the user to view the rendering under a variety of lighting conditions (cloudy or sunny) and to substitute other parameters as well. It can be employed as a guide for the user to demonstrate the type of glazing product at different stages of building construction.

Sometimes using solar shading elements can be a design decision that combines aesthetics with good efficiency and cost-effectiveness, protecting the glass from much of the solar radiation. Understanding the shading behavior of sunscreens in relation to variations in the intensity and incidence of solar radiation throughout the year is a key step for the designer to determine their ultimate consequences for energy consumption, comfort and thermal performance of the building. Shade.in is a tool for evaluating the efficiency of shading devices and helping to design them. By including data such as latitude, facade orientation, and shading element type, you can receive the incident solar radiation values.

An appropriate decision about the façade materials, and especially the glass, will directly influence the building’s thermal comfort levels, their costs during construction, and especially the maintenance costs and energy consumption many years after inauguration. It is therefore vital that the specification is accurate and that, in addition to aesthetics, all technical parameters are considered.

What eight leading economists predict for nonresidential construction in 2020 and 2021

Following modest increases in construction spending for nonresidential buildings in 2019, economists from eight leading industry organizations forecast slight growth in 2020 and 2021—1.5% and 0.9%, according to AIA’s latest Consensus Construction Forecast panel.

Public safety, education, healthcare, and office are the bright spots in a market that is entering growth-slowdown mode. However, no downturn is projected by the economists.

The public safety sector is expected to grow 7.2% in 2020, followed by education (3.9%), healthcare (3.4%), and office (3.0%). Four sectors—hotels, religious facilities, amusement/recreation, and retail—will take a step back in construction spending in 2020, according to the report.

More from the AIA Consensus Construction Forecast:
Construction spending last year was surprisingly weak, but current estimates suggest the industry had a modest increase in 2019. Retail construction activity was expected to underperform in 2019 but did not see the double-digit percentage declines that were expected. The AIA’s Consensus Construction forecast panel expects similar conditions this year and next.

“The broader economy is expected to continue to see slower growth this year, but the number of potential trouble spots seems to be diminishing,” said AIA Chief Economist Kermit Baker, Hon. AIA, PhD. “Revenue trends at architecture firms saw an uptick in the fourth quarter last year, which suggests construction spending will continue to see growth in the coming quarters.”

Elevating the human experience in public realm infrastructure

As we work together to create a sustainable world for future generations, there are many innovative solutions in the public realm of our cities and communities that reduce waste, energy demand and carbon footprint. But how do these physical infrastructure ideas respond to human needs, and our behavior and mindsets? We must equally consider people as we design, build and evolve our future communities.

I want each of us to consider the questions: What kind of world do we want to live in together? How are we including human experience in our planning for the future?

Around the world, new solutions are emerging that demonstrate the potential to harness renewable energy sources to power our communities. Cities are experimenting with innovative ideas for urban roadway surfaces that reduce stormwater run-off and heat-island effect. These ideas and others hold strong potential to solve physical infrastructure challenges. However, as we work to plan and design infrastructure in our public realm, we must consider quality of life, equity, economic vitality, health, and community connectivity. If we examine human need and define qualitative drivers, we can better the lives of our community members — the people putting our technical engineering, big infrastructure projects to use every day. With projects built around the way we live, we grasp the opportunity to weave together all aspects critical to building a vibrant future.

Communities buy into projects when they see the public good. Listening to the community, and pairing the quantitative and qualitative to tell a story develops a solution that resonates with the community, and not only gains support, but a sense of ownership and pride.

LISTEN TO THE COMMUNITY

Drivers and needs vary from region to region and person to person. Surveys are often used to gather data, but while survey data is helpful, it’s also limited. Questions often aren’t nuanced enough to get to the heart of what matters to residents. A city facing issues of social equity and affordable housing may benefit from new methods of community engagement to frame solutions in terms of health, job and housing access, rather than focusing only on density, roadway design or other physical solutions.

Community engagement methods like public meetings attempt to gather input, inform and educate people about changes coming to their community. But big infrastructure projects, like new roadway systems, new urban redevelopment plans or upgraded stormwater solutions can be challenging to understand — and almost abstract in their scale and influence. It takes more individualized interaction between people to capture and address the complexities of community need.

Community ethnography is a method used often by anthropologists. It’s a research method used to understand a population and its need. The inspiration behind that deep research process is what uncovers the community mindset to gain an understanding of why people make the decisions and choices they make.

For example, if a community experienced damaging flooding in specific neighborhoods, addressing their real fears and concerns about future damage to their homes through personas and storytelling may help address deep-seated emotions. We must connect with our community members’ hearts and minds.

This was well done in Denver, for the region’s Denver Mobility Blueprint project. The metro area’s future mobility plans were developed using technical transportation modeling, policy planning and a consideration for the unique mindsets, hopes and fears of residents within the region. The project began with a personal approach that included one-on-one conversations around kitchen tables with a wide variety of people across metro Denver.

Those in-depth conversations didn’t just ask, “What type of transportation do you use?” Instead, questions like, “How do you define quality of life?” were paired with exercises to rank quality of life factors. Details covered aspects from health and safety to work, productivity and even heritage — in addition to access to transportation.

To verify that what we learned from the smaller representative sample during face-to-face meetings was representative of a broader audience, we used social media and online technology. The big message we heard from those early conversations was that transportation enables quality of life. You may arrive home after a long day in a better mood because you’ve had a positive transportation experience through biking, or walking or carpooling. It’s not only about how you get from point A to point B. It’s about connecting with your community, and having the flexibility to live your life.

PAIR QUANTITATIVE SOLUTIONS WITH QUALITATIVE INSIGHTS TO TELL A STORY

When it’s time to present transportation models and new technologies to clients and communities, telling a story around the solutions can be powerful. Instead of presenting spreadsheets and numbers to the community, I’ve found that when we use experiential examples to demonstrate transportation improvements, we find our greatest support.

We followed this approach for the Denver Mobility Blueprint. During community interviews we learned young professionals used smart phone apps to locate social activities in the area, but they felt like visibility around transportation choices in the Denver Metro area was not as intuitive. For this groups, a “smart mobility app” that showed not only personal vehicle driving options, but options for scooters, public transit and Lyft, would improve the transportation experience and encourage use of alternative travel modes. That story around mobility experience was paired with quantitative measures during public presentations, as demonstrated below.

Once community priorities are clearly defined, match technical solutions with human needs to work each element of the broader plan together. One way to do this is to develop personas based on the community groups interviewed. This build contexts around significant project elements and how they’ll impact the community.

To present our solutions we zeroed in on these five personas, which were inspired by the people we met and worked within the Denver Metropolitan area, to show how implementing new technologies and solutions would positively impact relatable people.

Our “Jordan” persona, for instance, highlights how added mobility options for first and last mile services near a new bus station would enable someone like him to get additional work done on the commute, and how new micro-transit would make it convenient to connect with friends after work.

Someone like “Maria” could save time by using micro-transit to get around downtown with more direct options, and spend more time either working (increasing her income) or with family.

Quantifying the benefits of qualitative solutions helps people see the value.

It’s this unique blend of addressing the technical requirements alongside the human needs that makes big changes positive and manageable for the community. While gathering stakeholder input from surveys is beneficial, the shift in approach is best accomplished by connecting large, physical infrastructure changes in our built environment to actual needs identified by community residents.

Changes in a person’s home and community are inevitably emotionally charged. It’s only when we intertwine human needs with mobility solutions that we get to the heart of what our communities need to connect and prosper.

Architecture Billings Index Ends 2019 on Positive Uptick

According to new data from The American Institute of Architects, U.S. demand for design services in December 2019 increased for the third month in a row.

The AIA’s latest Architecture Billings Index (ABI) score of 52.5 for December reflects an increase in design services provided by U.S. architecture firms (any score above 50 indicates an increase in billings). During December, both the new project inquiries and design contracts scores were positive, posting scores of 58.7 and 53.4 respectively.

“Despite the ongoing slowdown in billings in the Northeast, balanced growth across sectors and regions looks more positive for the coming year,” said AIA Chief Economist, Kermit Baker, Hon. AIA, PhD. “Factors outside of the construction sector, such as trade policy and international events, could still impact demand for design services, however recent fears about a downturn in construction activity have largely subsided.”

Key ABI highlights for December 2019 include:

  • Regional averages: West (54.0); South (52.2); Midwest (51.9); Northeast (44.0)
  • Sector index breakdown: commercial/industrial (54.0); multi-family residential (51.0); mixed practice (50.8); institutional (50.8)
  • Project inquiries index: 58.7
  • Design contracts index: 53.4

Kate Simonen: Climate Activist Rallied Industry to Reduce Embodied Carbon

It has been a banner year for Kate Simonen and her burgeoning band of embodied carbon busters, bent on reducing the negative environmental impacts of building production. On Nov. 19, Simonen and her EC-reduction champions debuted the first free-to-use digital tool to calculate EC in materials. The same day, Marin County, Calif., approved the nation’s first low-carbon concrete building code. And after a slow start in 2017, the free-to-join Embodied Carbon Network finally gained traction.

As founding director of the decade-old Carbon Leadership Forum (CLF) at the University of Washington, Simonen has been stirring all three pots. “Kate is our figurehead,” says Wil V. Srubar, a professor of engineering at the University of Colorado Boulder and an ECN co-chair with Simonen and Erin McDade, senior program director of Architecture 2030. “It’s been a wild ride the last 12 months, and Kate has been a great driver,” he adds.

EC, the sum total of greenhouse gases emitted from material extraction to the jobsite, “is an entry point to acknowledge that we need to completely decarbonize” the buildings sector—not just operational carbon, says engineer-architect-researcher Simonen, also a professor in the university’s department of architecture.

Perhaps Simonen’s biggest EC-reduction coup is the Embodied Carbon in Construction Calculator. “EC3 is transformative,” says Ari Frankel, assistant vice president at Alexandria Real Estate Equities, one of six developers piloting EC3.

CLF incubated EC3 through a $713,000 grant from the Charles Pankow Foundation and other sponsors. Simonen is lead investigator, with teammates Phil Northcott, Change Labs CEO; Stacy Smedley, a director of sustainability for Skanska USA; and Don Davies, president of Magnusson Klemencic Associates.

While incubating EC3, Simonen also helped create Marin County’s low-carbon concrete code—spearheaded by Top 25 Newsmaker Bruce King—by leading its steering committee. She was “instrumental” in creating consensus among diverse stakeholders, says Alice Zanmiller, a planner for Marin County’s sustainability team.

In 2017, CLF created ECN to scale up the movement. A global and virtual communication platform for practitioners, educators, government officials and material producers, ECN is driving grass-roots change, including local policy initiatives.

Last year, the group grew from 600 to 1,800 members, located in 166 cities in 22 nations. Local chapters that hold in-person workshops sprang up in Seattle, the Bay Area, New York City, Boston and Vancouver, B.C. Chapter discussions are underway in Austin, Atlanta, Toronto and the Denver-Boulder area.

A native of Livermore, Calif., Simonen studied architectural engineering at the University of Colorado Boulder and then received two master’s degrees from the University of California, Berkeley—one in structural engineering and the mechanics of materials in 1991, and the other in architecture the following year.

While in practice, Simonen learned about using fly ash to lower concrete’s cement content. Later, she tried calculating the carbon footprint of green prefab homes imported from China. Eventually, she realized she was interested in research. In 2009, she landed at the university. Soon she had mastered environmental-impact life-cycle analyses for buildings.

Funded by its 42 member firms, CLF is “informing, inspiring and enabling” buildings professionals to reduce and ultimately eliminate EC. Currently, CLF is rallying green-building groups to collaborate and reduce duplicate efforts.

Even with EC-reduction progress, Simonen doesn’t expect to see any meaningful impact on the environment for at least 10 years. Still, she soldiers on, saying, “we have to try to make a difference.”

Construction contractor confidence surges into 2020, says ABC

Confidence among U.S. construction industry leaders increased in November 2019 with respect to sales, profit margins, and staffing, according to the Associated Builders and Contractors Construction Confidence Index.

Sales and profit margin expectations reached their highest levels since May 2019, while staffing expectations reached their highest level since April 2019.

Three-quarters of contractors expect sales to rise over the next six months and, as a result, nearly 65% expect to increase their staffing levels, indicating that the average contractor will face even greater challenges recruiting and retaining talent through the first half of 2020.

More than 50% of contractors expect their profit margins to increase over the next six months for the first time since August 2019. Fewer than 12% expect margins to decline, strongly suggesting that demand for construction services remains elevated and purchasers are willing to pay enough to offset rising compensation costs.

• The CCI for sales expectations increased from 63.8 to 69.5 in November.
• The CCI for profit margin expectations increased from 58.8 to 61.3.
• The CCI for staffing levels increased from 63.6 to 66.9.

“The U.S. economy retains significant momentum entering 2020,” said ABC chief economist Anirban Basu. “Accordingly, the nonresidential construction outlook remains stable. The duration of the economic expansion—already record-shattering—has more room to run. ABC’s Construction Backlog Indicator remained virtually unchanged at 8.8 months in November, and with job growth still apparent, demand for office and other forms of commercial construction will persist. Improved state and local government finances working in conjunction with ultra-low interest rates are helping to fuel additional spending in a variety of infrastructure-related categories, including water systems, flood control and public safety. Though there will always be reasons for concern, including those related to geopolitics, the achievement of a first phase trade deal with China and the new United States-Mexico-Canada trade agreement, which replaced NAFTA, should provide much-needed certainty regarding near-term economic prospects.”

CCI is a diffusion index. Readings above 50 indicate growth, while readings below 50 are unfavorable.